
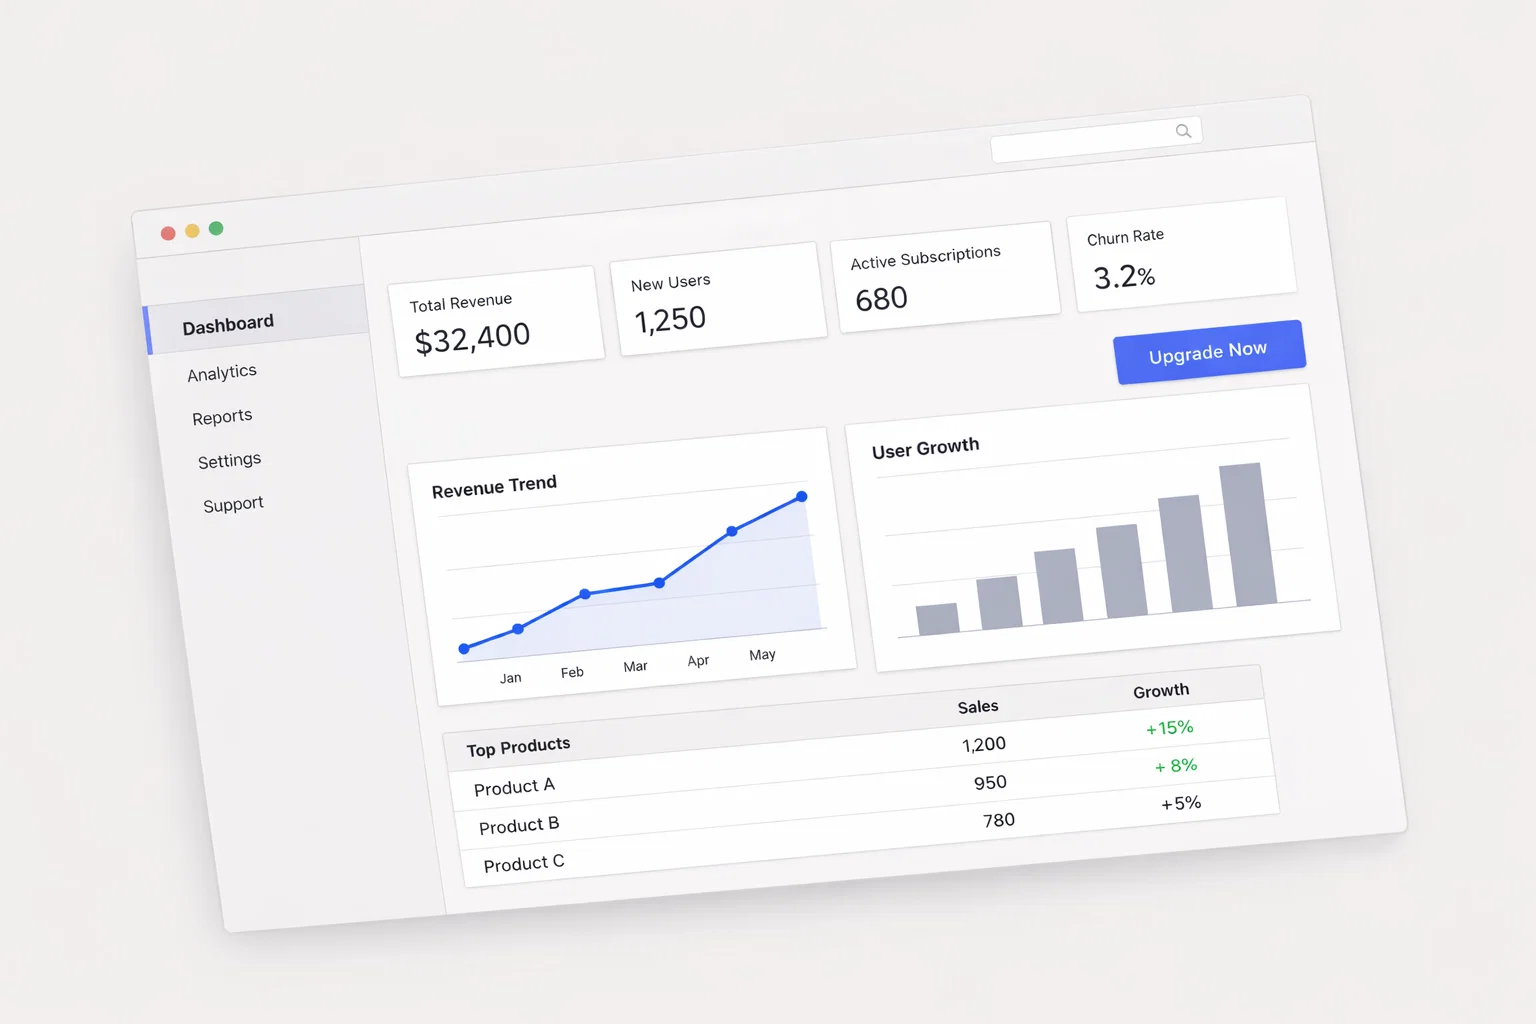

Stock market applications (investment apps) are execution platforms, not asset classes. Their value lies in enabling access, efficiency, and decision-making—not generating returns directly. Investment outcomes still depend on strategy, discipline, and risk management.
Key Takeaways:
- Investment apps enhance market access, execution speed, and data availability.
- Returns are driven by asset selection, allocation, and timing, not the app itself.
- Increased retail participation (2020–2026) has reshaped liquidity and volatility patterns.
- Apps vary significantly in cost structure, analytics, and execution quality.
| Metric | Assessment | Comment |
| Return Potential | Neutral | Depends on strategy, not platform |
| Risk Level | Medium | Elevated by behavioral biases |
| Liquidity | High | Real-time execution in most markets |
| Time Horizon | Flexible | Suitable for all horizons |
| Investor Profile | Beginner to Advanced | Depends on app sophistication |
Understanding the Nature of Stock Market Applications
Investment apps function as interfaces between investors and financial markets. They facilitate trade execution, portfolio monitoring, and increasingly, decision support through analytics.
Economic Function
- Provide market access (equities, ETFs, derivatives).
- Reduce friction in trade execution and settlement.
- Enable data-driven decision-making.
Return Generation Model
Returns are generated through:
- Capital appreciation
- Dividends
- Tactical allocation and timing
Structural Characteristics
- Low barriers to entry
- High competition among providers
- Rapid innovation (AI, automation, fractional shares)
Comparison with Traditional Brokerage
| Feature | Investment Apps | Traditional Brokers |
| Accessibility | High | Moderate |
| Cost | Low to zero commissions | Higher fees |
| Tools | Varies widely | Advanced |
| Personal Advice | Limited | Often available |
| Execution Quality | Mixed | Generally high |
Macroeconomic Drivers Affecting Investment App Usage
While apps themselves are tools, their effectiveness and investor behavior are influenced by macro conditions.
| Macro Factor | Impact Direction | Sensitivity |
| Interest Rates | Negative for equities when rising | High |
| Inflation | Drives sector rotation | Medium |
| GDP Growth | Supports risk assets | High |
| Liquidity Conditions | Influences trading volume | High |
| Regulation | Affects platform features | Medium |
Key Observations (2025–2026)
- Interest rate normalization reduces speculative trading.
- Retail participation remains elevated, increasing volatility.
- Quantitative trading dominance creates short-term inefficiencies.
- Global capital flows shift toward emerging and AI-driven sectors.
Market Structure of the Investment Application Ecosystem
Key Participants
- Retail investors
- Brokerage platforms
- Market makers
- Institutional investors
- Regulators
Structural Elements
- Commission-free trading models
- Payment for order flow (PFOF) in some jurisdictions
- Integration with banking and fintech ecosystems
Market Characteristics
- Highly competitive
- Technology-driven
- Increasing regulatory scrutiny
Investment Vehicles Accessible via Applications
Apps provide access to multiple asset classes, making them multi-asset gateways.
| Vehicle | Liquidity | Cost | Risk Level | Suitable For |
| Individual Stocks | High | Low | Medium–High | Active investors |
| ETFs | High | Low | Medium | Passive investors |
| Mutual Funds | Medium | Medium | Medium | Long-term investors |
| Options | High | Medium | High | Advanced traders |
| Bonds | Medium | Low | Low–Medium | Income investors |
Access Process
- Account setup and verification
- Fund deposit
- Asset selection
- Order execution
- Portfolio monitoring
Fundamental Analysis Framework for App-Based Investing
Even with advanced apps, fundamental discipline remains critical.
Core Valuation Metrics
| Metric | Purpose | Interpretation |
| P/E Ratio | Earnings valuation | High = growth expectations |
| P/B Ratio | Asset valuation | Useful for financials |
| Free Cash Flow | Financial health | Strong = sustainable |
| ROE | Profitability | Higher = efficient capital use |
Key Indicators
- Earnings growth consistency
- Margin stability
- Competitive positioning
- Industry trends
Formula Example:
Intrinsic Value ≈ (FCF × (1 + g)) / (r – g)
Where:
g = growth rate, r = discount rate
Technical and Quantitative Evaluation
Apps increasingly integrate technical and algorithmic tools.
| Indicator | Function | Use Case |
| Moving Averages | Trend identification | Entry/exit timing |
| RSI | Momentum | Overbought/oversold |
| Volatility (VIX) | Risk sentiment | Position sizing |
| Volume | Confirmation | Breakout validation |
Execution Framework
- Identify trend direction
- Confirm with volume
- Evaluate volatility
- Execute with risk controls
Risk Assessment in App-Based Investing
| Risk Type | Probability | Impact | Mitigation |
| Market Risk | High | High | Diversification |
| Behavioral Risk | High | High | Rules-based strategy |
| Liquidity Risk | Low | Medium | Trade liquid assets |
| Regulatory Risk | Medium | Medium | Use compliant platforms |
| Operational Risk | Low | Medium | Platform diversification |
Key Behavioral Risks
- Overtrading
- Herd behavior
- Reaction to short-term volatility
Portfolio Allocation Strategy Using Investment Apps
Apps should be viewed as execution layers within a broader portfolio strategy.
| Allocation Type | Equity | Bonds | Alternatives | Risk Level |
| Conservative | 30% | 60% | 10% | Low |
| Balanced | 60% | 30% | 10% | Medium |
| Growth | 80% | 10% | 10% | High |
Allocation Methodology
- Define investment objective
- Assess risk tolerance
- Select asset mix
- Allocate capital
- Rebalance periodically
Taxation and Legal Considerations
Key Factors
- Capital gains tax on profits
- Dividend income taxation
- Reporting obligations for trades
- Cross-border tax implications
| Structure | Tax Efficiency | Complexity |
| Direct Stocks | Medium | Low |
| ETFs | High | Low |
| Derivatives | Low | High |
ESG and Sustainability Considerations
| ESG Factor | Relevance | Risk Level |
| Environmental | High | Medium |
| Social | Medium | Medium |
| Governance | High | High |
Observations
- ESG integration is increasingly embedded in apps
- Regulatory focus on disclosure is rising
- Long-term capital flows favor sustainable companies
Exit Strategy for Investments
Structured Exit Plan
- Define target return (e.g., 15–20%)
- Set stop-loss (e.g., -10%)
- Use time-based exits (e.g., 12 months)
- Apply hedging if needed
- Maintain liquidity awareness
| Scenario | Action |
| Target reached | Take profit |
| Market downturn | Reduce exposure |
| Thesis invalidated | Exit immediately |
Comparative Analysis: Investment Apps vs Traditional Investing Channels
| Factor | Investment Apps | Traditional Brokers |
| Cost | Low | Higher |
| Accessibility | High | Moderate |
| Tools | Variable | Advanced |
| Discipline Requirement | High | Moderate |
Strengths
- Accessibility
- Low cost
- Speed
Weaknesses
- Behavioral risk
- Limited advisory support
- Over-simplification of investing
Implementation Roadmap for Investing via Applications
- Define financial goals
- Determine risk tolerance
- Select appropriate app
- Conduct market research
- Choose investment vehicles
- Allocate capital
- Execute trades
- Monitor performance
- Rebalance portfolio
Appendix: Metrics, Ratios, and Tools
| Metric | Formula | Purpose |
| Sharpe Ratio | (Return – Risk-free rate) / Volatility | Risk-adjusted return |
| Beta | Covariance / Variance | Market sensitivity |
| Alpha | Excess return | Manager performance |
Key Data Sources
- Company financial statements
- Central bank policy updates
- Market indices
- Economic indicators
Frequently Asked Questions
- Minimum capital required: Varies; many apps allow starting with <$100
- Ideal time horizon: Minimum 3–5 years for equities
- Common mistakes:
- Overtrading
- Lack of diversification
- Emotional decision-making
- Suitable investors: All levels, depending on app complexity
- Risk mitigation:
- Diversification
- Stop-loss strategies
- Long-term focus
Final Insight
Investment applications have transformed market access but do not replace disciplined investment strategy. Institutional-grade investing still requires structured analysis, risk management, and macro awareness. The app is merely the interface—performance depends on the investor.